*Backtesting System ⚉ OVERVIEW ⚉
One of the best Systems for Backtesting your Strategies.
Incredibly flexible, simple, fast and feature-rich system — will solve most of your queries without much effort.
Many systems for setting StopLoss, TakeProfit, Risk Management and advanced Filters.
All you need to do is plug in your indicator and start Backtesting .
I intentionally left the option to use my System on Full Power before you load your indicator into it.
The system uses the built-in simple and popular moving average crossover signal for this purpose. (EMA 50 & 200).
Also Highly Recommend that you Fully use ALL of the features of this system so that you understand how they work before you ask questions.
Also tried to leave TIPS for each feature everywhere, read Tips, activate them and see how they work.
But before you use this system, I Recommend you to read the following description in Full.
—————— How to connect your indicator in 2 steps:
Adapt your indicator by adding only 2 lines of code and then connect it to this Backtesting System.
Step 1 — Create your connector, For doing so:
• 1 — Find or create in your indicator where are the conditions printing the Long-Buy and Short-Sell signals.
• 2 — Create an additional plot as below
I'm giving an example with a Two moving averages cross.
Please replicate the same methodology for your indicator wether it's a MACD, RSI , Pivots, or whatever indicator with Clear Buy and Sell conditions.
//@version=5
indicator('Moving Average Cross', overlay = true)
MA200 = ta.𝚎𝚖𝚊(close, 200)
MA50 = ta.𝚎𝚖𝚊(close, 50)
// Generate Buy and Sell conditions
buy = ta.crossover (MA200, MA50)
sell = ta.crossunder (MA200, MA50)
plot(MA200, color=color.green)
plot(MA50 , color=color.red )
bgcolor(color = buy ? color.green : sell ? color.red : na, title='SIGNALS')
// ———————————————— SIGNAL FOR SYSTEM ————————————————
Signal = buy ? +1 : sell ? -1 : 0
plot(Signal, title='🔌Connector🔌', display = display.none)
// —————— 🔥 The Backtesting System expects the value to be exactly +1 for the 𝚋𝚞𝚕𝚕𝚒𝚜𝚑 signal, and -1 for the 𝚋𝚎𝚊𝚛𝚒𝚜𝚑 signal
Basically, I identified my Buy & Sell conditions in the code and added this at the bottom of my indicator code
Now you can connect your indicator to the Backtesting System using the Step 2
Step 2 — Connect the connector
• 1 — Add your updated indicator to a TradingView chart and Add the Backtesting System as well to the SAME chart
• 2 — Open the Backtesting System settings and in the External Source field select your 🔌Connector🔌 (which comes from your indicator)
_______________________________
⚉ MAIN SETTINGS ⚉
‾‾‾‾‾‾‾‾‾‾‾‾‾‾‾‾‾‾‾‾‾‾‾‾‾‾‾‾‾‾‾
𝐄𝐱𝐭𝐞𝐫𝐧𝐚𝐥 𝐒𝐨𝐮𝐫𝐜𝐞 — Select your indicator. Add your indicator by following the 2 steps described above and select it in the menu. To familiarize yourself with the system until you select your indicator, you will have an in-built strategy of crossing the two moving EMA's of 50 and 200.
Long Deals — Enable/Disable Long Deals.
Short Deals — Enable/Disable Short Deals.
Wait End Deal — Enable/Disable waiting for a trade to close at Stop Loss/Take Profit. Until the trade closes on the Stop Loss or Take Profit, no new trade will open.
Reverse Deals — To force the opening of a trade in the opposite direction.
ReEntry Deal — Automatically open the same new deal after the deal is closed.
ReOpen Deal — Reopen the trade if the same signal is received. For example, if you are already in the long and a new signal is received in the long, the trade will reopen. * Does not work if Wait End Deal is enabled.
𝐓𝐚𝐤𝐞 𝐏𝐫𝐨𝐟𝐢𝐭:
None — Disables take profit. Useful if you only want to use dynamic stoplosses such as MA, Fast-Trailing, ATR Trail.
FIXED % — Fixed take profit in percent.
FIXED $ — Fixed Take in Money.
ATR — Fixed Take based on ATR.
R:R — Fixed Take based on the size of your stop loss. For example, if your stop is 10% and R:R=1, then the Take would be 10%. R:R=3 Take would be 30%, etc.
HH / LL — Fixed Take based on the previous maximum/minimum (extremum).
𝐒𝐭𝐨𝐩 𝐋𝐨𝐬𝐬:
None — Disables Stop Loss. Useful if you want to work without a stop loss. *Be careful if Wait End Deal is enabled, the trade may not close for a long time until it reaches the Take.
FIXED % — Fixed Stop in percent.
FIXED $ — Fixed Stop in Money.
TRAILING — Dynamic Trailing Stop like on the stock exchanges.
FAST TRAIL — Dynamic Fast Trailing Stop moves immediately in profit and stays in place if the price stands still or the price moves in loss.
ATR — Fixed Stop based on the ATR.
ATR TRAIL — Dynamic Trailing Stop based on the ATR.
LO / HI — A Fixed Stop based on the last Maximum/Minimum extemum. Allows you to place a stop just behind or above the low/high candle.
MA — Dynamic Stop based on selected Moving Average. * You will have 8 types of MA (EMA, SMA, HMA, etc.) to choose from, but you can easily add dozens of other MAs, which makes this type of stop incredibly flexible.
Add % — If true, then with the "𝗦𝘁𝗼𝗽 %" parameter you can add percentages to any of the current SL. Can be especially useful when using Stop - 𝗔𝗧𝗥 or 𝗠𝗔 or 𝗟𝗢/𝗛𝗜. For example with 𝗟𝗢/𝗛𝗜 to put a stop for the last High/Low and add 0.5% additional Stoploss.
Fixed R:R — If the stop loss is Dynamic (Trailing or MA) then if R:R true can also be made Dynamic * Use it carefully, the function is experimental.
_________________________________________
⚉ TAKE PROFIT LEVELS ⚉
‾‾‾‾‾‾‾‾‾‾‾‾‾‾‾‾‾‾‾‾‾‾‾‾‾‾‾‾‾‾‾‾‾‾‾‾‾‾‾‾‾
A unique method of constructing intermediate Take Profit Levels will allow you to select up to 5 intermediate Take Profit Levels and one intermediate Stop Loss.
Intermediate Take Profit Levels are perfectly calculated into 5 equal parts in the form of levels from the entry point to the final Take Profit target.
All you need to do is to choose the necessary levels for fixing and how much you want to fix at each level as a percentage. For example, TP 3 will always be exactly between the entry point and the Take Profit target. And the value of TP 3 = 50 will close 50% of the amount of the remaining size of the position.
Note: all intermediate SL/TP are closed from the remaining position amount and not from the initial position size, as TV does by default.
SL 0 Position — works in the same way as TP 1-5 but it's Stop. With this parameter you can set the position where the intermediate stop will be set.
Breakeven on TP — When activated, it allows you to put the stop loss at Breakeven after the selected TP is reached. For this function to work as it should - you need to activate an intermediate Take. For example, if TP 3 is activated and Breakeven on TP = 3, then after the price reaches this level, the Stop loss will go to Breakeven.
* This function will not work with Dynamic Stoplosses, because it simply does not make sense.
CoolDown # Bars — When activated, allows you to add a delay before a new trade is opened. A new trade after CoolDown will not be opened until # bars pass and a new signal appears.
_____________________________
⚉ TIME FILTERS ⚉
‾‾‾‾‾‾‾‾‾‾‾‾‾‾‾‾‾‾‾‾‾‾‾‾‾‾‾‾‾
Powerful time filter code that allows you to filter data based on specific time zones, dates, and session days. This code is ideal for those who need to analyze data from different time zones and weed out irrelevant data.
With Time Filter, you can easily set the starting and ending time zones by which you want to filter the data.
You can also set a start and end date for your data and choose which days of the week to include in the analysis. In addition, you can specify start and end times for a specific session, allowing you to focus your analysis on specific time periods.
_________________________________
⚉ SIGNAL FILTERS ⚉
‾‾‾‾‾‾‾‾‾‾‾‾‾‾‾‾‾‾‾‾‾‾‾‾‾‾‾‾‾‾‾‾‾
Signal Filters — allows you to easily customize and optimize your trading strategies based on 10 filters.
Each filter is designed to help you weed out inaccurate signals to minimize your risks.
Let's take a look at their features:
__________________________________
⚉ RISK MANAGEMENT ⚉
‾‾‾‾‾‾‾‾‾‾‾‾‾‾‾‾‾‾‾‾‾‾‾‾‾‾‾‾‾‾‾‾‾‾
Risk management tools that allow you to set the maximum number of losing trades in a row, a limit on the number of trades per day or week and other filters.
Loss Streak — Set Max number of consecutive loss trades.
Win Streak — Max Winning Streak Length.
Row Loss InDay — Max of consecutive days with a loss in a row.
DrawDown % — Max DrawDown (in % of strategy equity).
InDay Loss % — Set Max Intraday Loss.
Daily Trades — Limit the number of MAX trades per day.
Weekly Trades — Limit the number of MAX trades per week.
* 🡅 I would Not Recommend using these functions without understanding how they work.
Order Size — Position Size
• NONE — Use the default position size settings in Tab "Properties".
• EQUITY — The amount of the allowed position as a percentage of the initial capital.
• Use Net Profit — On/Off the use of profit in the following trades. *Only works if the type is EQUITY.
• SIZE — The size of the allowed position in monetary terms.
• Contracts — The size of the allowed position in the contracts. 1 Сontract = Сurrent price.
________________
⚉ NOTES ⚉
‾‾‾‾‾‾‾‾‾‾‾‾‾‾‾‾
It is important to note that I have never worked with Backtesting and the functions associated with them before.
It took me about a month of slow work to build this system.
I want to say Big Thanks:
• The PineScripters🌲 group, the guys suggested how to implement some features. Especially @allanster
• Thanks to all those people who share their developments for free on TV and not only.
• I also thank myself for not giving up and finishing the project, and not trying to monetize the system by selling it. * Although I really want the money :)
I tried hard to make it as fast and convenient as possible for everyone who will use my code.
That's why I didn't use any libraries and dozens of heavy functions, and I managed to fit in 8+-functions for the whole code.
Absolutely every block of code I tried to make full-fledged modular, that it was easy to import/edit for myself (you).
I have abused the Ternary Pine operator a little (a lot) so that the code was as compact as possible.
Nevertheless, I tried very hard to keep my code very understandable even for beginners.
At last I managed to write 500 lines of code, making it one of the fastest and most feature-rich systems out there.
I hope everyone enjoys my work.
Put comments and write likes.
Поиск скриптов по запросу "take profit"

Strategy Template + Performance & Returns table + ExtrasA script I've been working on since summer 2022. A template for any strategy so you just have to write or paste the code and go straight into risk management settings
Features:
>Signal only Longs/only Shorts/Both
>Leverage system
>Proper fees calculation (even with leverage on)
>Different Stop Loss systems: Simple percentage, 4 different "move to Break Even" systems and Scaling SL after each TP order (read the disclaimer at the bottom regarding this and the TV % profitable metric)
>2 Take Profit systems: Simple percentages, or Risk/reward ratios based on SL level
>Additional option on TP so last one "rides free" until closure of position or Stoploss is hit (for more than 1 orders)
>Up to 5 TP orders
>Show or hide SL/TP levels on demand
>2 date filters. Manual filter is nothing new, enter two dates/hours and filter will turn on. BUT automatic filter is another thing (thanks to user @bfr_ for his help in codingthis feature)
>AUTOMATIC DATE FILTER. Allows you to split all historical data on the chart in X periods, then choose the range of periods used. Up to 10 but that can be changed, instructions included. Useful for WalkForward simulations, haven't seen a script in TradingView that allows you to do this and test your strategy on "unseen data" automatically
EXTRA SETTINGS
Besides, some additions I like to add to my codes:
>Returns table for monthly and weekly performance. Requires recalculation on every tick. This is a modified version of @QuantNomad's work. May add lower TF options later on
>Volume Based S/R system. Original work from @shtcoinr
>One feature that was made by me, the "portfolio table". Yields info and metrics of your strategy, current position and balance. You're able to turn it off and change its size
Should anyone find an error, or have any idea on how to improve this code, please contact me. Future updates could come, stay tuned
DISCLAIMER:
In order to have accurate StopLoss hit, I had to change the previous system, which was a "close position on candle close" instead at actual stoploss level. It was fixed, but resulted on inflation of the number of trading orders, thus reducing the percent profitable and making it strongly biased and unreal. Keep that in mind, that "real" profitability could be 2x or 3x the metric TradingView says. If your strategy has a really high trading frequency, resulting in 3000+ orders, might be a problem. Try to make use of the automatic/manual date filter as workaround, I have no means of changing this, seems it is not a bug but an intended design of the PineScript Code

Simple SuperTrend Strategy for BTCUSD 4HHello guys!, If you are a swing trader and you are looking for a simple trend strategy, you should check this one. Based in the supertrend indicator, this strategy will help you to catch big movements in BTCUSD 4H and avoid losses as much as possible in consolidated situations of the market
This strategy was designed for BTCUSD in 4H timeframe
Backtesting context: 2020-01-02 to 2023-01-05 (The strategy has also worked in previous years)
Trade conditions:
Rules are actually simple, the most important thing is the risk and position management of this strategy
For long:
Once Supertrend changes from a downtrend to a uptrend, you enter into a long position. The stop loss will be defined by the atr stop loss
The first profit will be of 0.75 risk/reward ratio where half position will be closed. When this happens, you move the stop loss to break even.
Now, just will be there two situations:
Once Supertrend changes from a uptrend to a downtrend, you close the other half of the initial long position.
If price goes againts the position, the position will be closed due to breakeven.
For short:
Once Supertrend changes from a uptrend to a downtrend, you enter into a short position. The stop loss will be defined by the atr stop loss
The first profit will be of 0.75 risk/reward ratio where half position will be closed. When this happens, you move the stop loss to break even.
Like in the long position, just will be there two situations:
Once Supertrend changes from a downtrend to a uptrend, you close the other half of the initial short position.
If price goes againts the position, the position will be closed due to breakeven.
Risk management
For calculate the amount of the position you will use just a small percent of your initial capital for the strategy and you will use the atr stop loss for this.
Example: You have 1000 usd and you just want to risk 2,5% of your account, there is a long signal at price of 20,000 usd. The stop loss price from atr stop loss is 19,000. You calculate the distance in percent between 20,000 and 19,000. In this case, that distance would be of 5,0%. Then, you calculate your position by this way: (initial or current capital * risk per trade of your account) / (stop loss distance).
Using these values on the formula: (1000*2,5%)/(5,0%) = 500usd. It means, you have to use 500 usd for risking 2.5% of your account.
We will use this risk management for apply compound interest.
Script functions
Inside of settings, you will find some utilities for display atr stop loss, supertrend or positions.
You will find the settings for risk management at the end of the script if you want to change something. But rebember, do not change values from indicators, the idea is to not over optimize the strategy.
If you want to change the initial capital for backtest the strategy, go to properties, and also enter the commisions of your exchange and slippage for more realistic results.
Signals meanings:
L for long position. CL for close long position.
S for short position. CS for close short position.
Tp for take profit (it also appears when the position is closed due to stop loss, this due to the script uses two kind of positions)
Exit due to break even or due to stop loss
Some things to consider
USE UNDER YOUR OWN RISK. PAST RESULTS DO NOT REPRESENT THE FUTURE.
DEPENDING OF % ACCOUNT RISK PER TRADE, YOU COULD REQUIRE LEVERAGE FOR OPEN SOME POSITIONS, SO PLEASE, BE CAREFULL AND USE CORRECTLY THE RISK MANAGEMENT
The amount of trades closed in the backtest are not exactly the real ones. If you want to know the real ones, go to settings and change % of trade for first take profit to 100 for getting the real ones. In the backtest, the real amount of opened trades was of 194.
Indicators used:
Supertrend
Atr stop loss by garethyeo
This is the fist strategy that I publish in tradingview, I will be glad with you for any suggestion, support or advice for future scripts. Do not doubt in make any question you have and if you liked this content, leave a boost. I plan to bring more strategies and useful content for you!

Strategy Myth-Busting #20 - HalfTrend+HullButterfly - [MYN]#20 on the Myth-Busting bench, we are automating the " I Found Super Easy 1 Minute Scalping System And Backtest It 100 Times " strategy from " Jessy Trading " who claims 30.58% net profit over 100 trades in a couple of weeks with a 51% win rate and profit factor of 1.56 on EURUSD .
This one surprised us quite a bit. Despite the title of this strategy indicating this is on the 1 min timeframe, the author demonstrates the backtesting manually on the 5 minute timeframe. Given the simplicity of this strategy only incorporating a couple of indicators, it's robustness being able to be profitable in both low and high timeframes and on multiple symbols was quite refreshing.
The 3 settings which we need to pay most attention to here is the Hull Butterfly length, HalfTrend amplitude and the Max Number Of Bars Between Hull and HalfTrend Trigger. Depending on the timeframe and symbol, these settings greatly impact the performance outcomes of the strategy. I've listed a couple of these below.
And as always, If you know of or have a strategy you want to see myth-busted or just have an idea for one, please feel free to message me.
This strategy uses a combination of 3 open-source public indicators:
Hull Butterfly Oscillator by LuxAlgo
HalfTrend by Everget
Trading Rules
5 min candles but higher / lower candles work too.
Stop loss at swing high/low
Take Profit 1.5x the risk
Long
Hull Butterfly gives us green column, Wait for HalfTrend to present an up arrow and enter trade.
Short
Hull Butterfly gives us a red column , Wait for HalfTrend to present a down arrow and enter trade.
Alternative Trading Settings for different time frames
1 Minute Timeframe
Move the Hull Butterfly length from the default 11 to 9
Move the HalfTrend Amplitude from the default 2 to 1
Enabling ADX Filter with a 25 threshold
2 Hour Timeframe
Move the HalfTrend Amplitude from the default 2 to 1
Laddered Take Profits from 14.5% to 19% with an 8% SL

Bitcoin Scalping Strategy (Sampled with: PMARP+MADRID MA RIBBON)
DISCLAIMER:
THE CONTENT WITHIN THIS STRATEGY IS CREATED FROM TWO INDICATORS CREATED BY TWO PINESCRIPTER'S. THE STRATEGY WAS EXECUTED BY MYSELF AND REVERSE-ENGINEERED TO MEET THE CONDITIONS OF THE INTENDED STRATEGY REQUESTOR. I DO NOT TAKE CREDIT FOR THE CONTENT WITHIN THE ESTABLISHED LINES MADE CLEAR BY MYSELF.
The Sampled Scripts and creators:
PMAR/PMARP by @The_Caretaker Link to original script:
Madrid MA RIBBON BAR by @Madrid Link to original script:
Cheat Code's strategy notes:
This sampled strategy (Requested by @elemy_eth) is one combining previously created studies. I reverse-engineered the local scope for the Madrid moving average color plots and set entry and exit conditions for certain criteria met. This strategy is meant to deliver an extremely high hit rate on a daily time frame. This is made possible because of the very low take profit percentage, during the context of a macro downtrend it is made easier to hit 1-3% scalps which is made visible with the strategy using sampled scripts I created here.
How it works:
Entry Conditions:
-Enter Long's if the lime color conditions are met true using the script detailed by Marid's MA
- No re-entry into positions needs to be met true (this prevents pyramiding of orders due to conditions being met true) applicable to both long and short side entries.
- To increase hit rate and prevent traps both the parameters of rsi being sub 80 and no previously engulfing candles need to be met true to enter a long position.
- Enter Short's if the red color conditions of Madrid's moving average are met true.
- Closing Long positions are typically not met within this indicator, however, it still sometimes triggers if necessary. This consists of a pmarp sub 99 and a position size greater than 0.0
- Closing Short positions are typically not met within this indicator, however, it still sometimes triggers if necessary. This consists of a pmarp over 01 and a position size less than 0.0
- Stop Loss: 27.75% Take Profit: 1% (Which does not trigger on ticks over 1% so you will see average trade profits greater than 1%)
BYBIT:BTCUSDT BINANCE:BTCUSDT COINBASE:BTCUSD
Best Of Luck :)
-CheatCode1

Squeeze Momentum Strategy [LazyBear] Buy Sell TP SL Alerts-Modified version of Squeeze Momentum Indicator by @LazyBear.
-Converted to version 5,
-Taken inspiration from @KivancOzbilgic for its buy sell calculations,
-Used @Bunghole strategy template with Take Profit, Stop Loss and Enable/Disable Toggles
-Added Custom Date Backtesting Module
------------------------------------------------------------------------------------------------------------------------
All credit goes to above
Problem with original version:
The original Squeeze Momentum Strategy did not have buy sell signals and there was alot of confusion as to when to enter and exit.
There was no proper strategy that would allow backtesting on which further analysis could be carried out.
There are 3 aspects this strategy:
1 ) Strategy Logic (easily toggleable from the dropdown menu from strategy settings)
- LazyBear (I have made this simple by using Kivanc technique of Momentums Moving Average Crossover, BUY when MA cross above signal line, SELL when crossdown signal line)
- Zero Crossover Line (BUY signal when crossover zero line, and SELL crossdown zero line)
2) Long Short TP and SL
- In strategies there is usually only 1 SL and 1 TP, and it is assumed that if a 2% SL giving a good profit %, then it would be best for both long and short. However this is not the case for many. Many markets/pairs, go down with much more speed then they go up with. Hence once we have a profitable backtesting setting, then we should start optimizing Long and Short SL's seperately. Once that is done, we should start optimizing for Long and Short TP's separately, starting with Longs first in both cases.
3) Enable and Disable Toggles of Long and Short Trades
- Many markets dont allow short trades, or are not suitable for short trades. In this case it would be much more feasible to disable "Short" Trading and see results of Long Only as a built in graphic view of backtestor provides a more easy to understand data feed as compared to the performance summary in which you have to review long and short profitability separately.
4) Custom Data Backtesting
- One of most crucial aspects while optimizing for backtesting is to check a strategies performance on uptrends, downtrend and sideways markets seperately as to understand the weak points of strategy.
- Once you enable custom date backtesting, you will see lines on the chart which can be dragged left right based on where you want to start and end the backtesting from and to.
Note:
- Not a financial advise
- Open to feedback, questions, improvements, errors etc.
- More info on how the squeeze momentum works visit LazyBear indicator link:
Happy Trading!
Cheers
M Tahreem Alam @mtahreemalam

RSI+PA+PrTPHi everybody,
This strategy is a RSI, Price Averaging, Pyramiding Strategy based on the earlier RSI+PA+DCA strategy. See below.
For this slightly different strategy I left the DCA option out and instead focused on the Take Profit calculation. In the previous strategy the Take Profit was directly connected to the Average Price level with a specified take profit %. When the price reached the Take Profit all positions where exited. The strategy opened multiple position based on the PA price levels. The separate positions can close when they reach separately specified Take Profit Limit. Each time the prices crosses the PA layer again the position can be re-opened. This causes the average price to drop each time a separate position is opened and closed.
I thought it was an interesting way to minimize losses and in general it works fine. Only when the market goes bearish it can cause significant losses
For the lack of a better word, I dubbed it Progressive Take Profit. The PrTP works different and is less risky. It doesn't directly follow the average price development and is calculated for a part based on the estimated profits of the separate closed positions. Every time a separate position is closed, the profit of that position is deducted of the Take Profit Limit. This causes the Take Profit Limit to drop les drastically then the average price and the whole position will only be closed when the separately opened and closed positions made up for the biggest losses.
There are still some aspects in the puzzle that are not fully worked out yet and I am still working on it, but I wanted to share this idea already and maybe you have some thoughts about it.
The next step is to re-implement a better worked out DCA function.
To be continued.
Up/Down Strategy - ContrarianThis is a consecutive bar up/down strategy for going long when the short condition is met or going short when the long condition is met. This is known in trading as taking contrarian signals and is helpful when an asset can provide only losses with a given strategy. In theory taking the opposing trade should produce a profit. With this strategy you can specify how many bars down to enter long and how many bars up to enter short. It also has code to check and make sure the condition is still true when launching the official alert, which helps back testing and live results line up, however be sure to enter commission and slippage into the properties to accurately reflect profits. I added back testing date ranges to this so you can easily pull up and see back tested results for a certain date range. I also added a buy and sell messages, close messages and take profit/stop loss message fields in the properties so you can launch alerts that will work with automated trading services. Simply enter your messages into those fields in the properties and then when you create an alert enter {{strategy.order.alert_message}} into the alert body and it will dynamically pull in your buy and sell messages when it fires alerts. I also added time restriction so you can enter trades only during the time frame specified. You can change it to any time frame, such at 0930-1600. Set the time restriction field to empty by default since otherwise the strategy won't take all trades like normal. So to enable time restriction enter a time frame in the format 0000-0000. I also added the ability to check off a box that will close the open trade at the end of the time restriction. So if you set the time frame to 0930-1600 and check off to enable close trade at end of time frame then it will look to exit the trade at the close of the next bar.

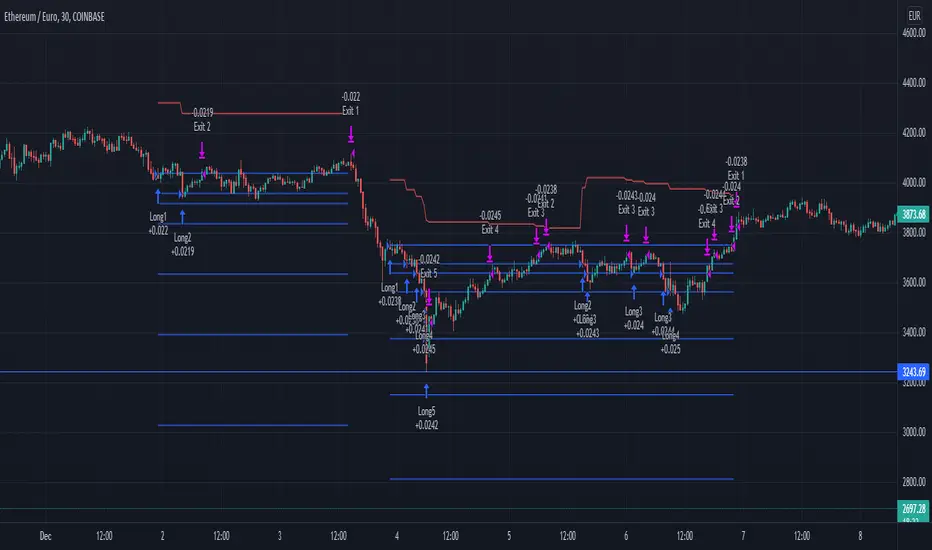
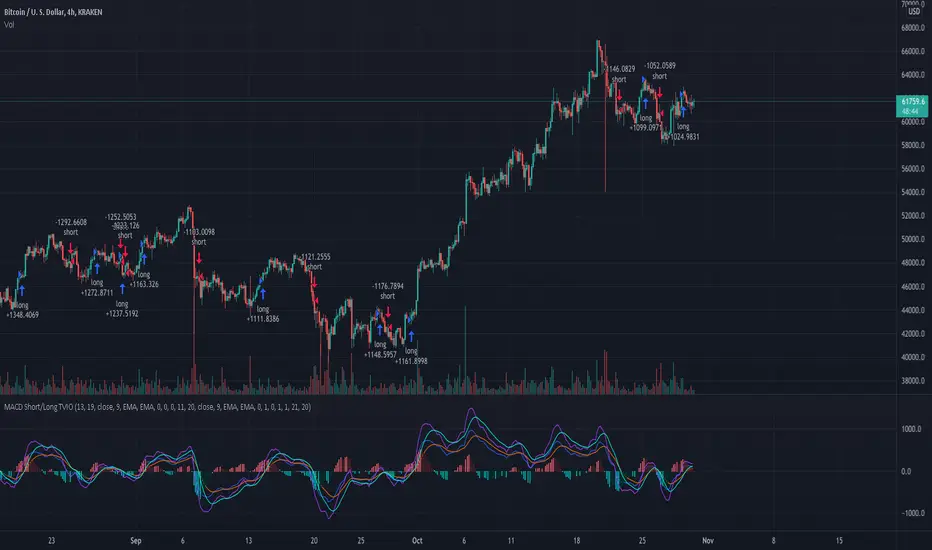
MacD Short and/or Long with Bi-Directional TP and SL This tool allows you to test any variable value for MacD and Signal for going Long or Short with each market direction having customizable values for stop loss and take profit.
For example, sometimes the MacD and Signal values are better with different lengths between Short and Long. You can use this tool to see them overlaid and determine the best settings for going one direction or the other.
This script was preset for use with XBTUSD on the 4 hour time frame. Another example with this in mind, is take profits and stop losses might not work in the Long market direction but going Short does! Without this tool that would be hard to see since typically stop loss and take profit is applied to both directions. I found with this tool that a 20% take profit seems to be a good sweet spot for going short with this strategy.
You can customize which MacD histogram you see by going to the style section and turning off the Short or Long parameters so you can see only 1 histogram at a time if you wish.
If you have any questions, please PM me.
Risk Management Tool [LuxAlgo]Good money management is one of the fundamental pillars of successful trading. With this indicator, we propose a simple way to manage trading positions. This tool shows Profit & Loss (P&L), suggests position size given a certain risk, sets stop losses and take profit levels using fixed price value/percentage/ATR/Range, and can also determine entries from crosses with technical indicators which is particularly handy if you don't want to set an entry manually.
1. Settings
Position Type: Determines if the position should be a "Long" or "Short".
Account Size: Determines the total capital of the trading account.
Risk: The maximum risk amount for a trade. Can be set as a percentage of the account size or as a fixed amount.
Entry Price: Determines the entry price of the position.
Entry From Cross: When enabled, allows to set the entry price where a cross with an external source was produced.
1.1 Stop Loss/Take Profit
Take Profit: Determines the take profit level, which can be determined by a value or percentage.
Stop Loss: Determines the stop loss level, which can be determined by a value or percentage.
2. Usage
One of the main usages of position management tools is to determine the position size to allocate given a specific risk amount and stop-loss. 2% of your capital is often recommended as a risk amount.
Our tool allows setting stop losses and take profits with different methods.
The ATR method sets the stop loss/take profit one ATR away from the entry price, with the ATR period being determined in the drop-down menu next to the selected methods. The range method works similarly but instead of using the ATR, we use a rolling range with a period determined in the drop-down menu next to the selected methods as well.
Unlike the available position management tool on TradingView, the entry can be determined from a cross between the price an an external source. The image above shows entries from the Volatility Stop indicator. This is particularly useful if you set positions based on trailing stops.

Optimized Keltner Channels SL/TP Strategy for BTCThis strategy is optimized for Bitcoin with the Keltner Channel Strategy, which is TradingView's built-in strategy. In the original Keltner Channel Strategy, it was difficult to predict the timing of entry because the Buy and Sell signals floated in the middle of the candle in real time. This strategy is convenient because if the bitcoin price hits the top or bottom of the Keltner Channel and closes the closing price, you can enter Buy or Sell at the next candle start price. In addition, this strategy provides Stop Loss and Take Profit functions to maximize profit.
_________________________________
Recommended settings are below.
- length: 9
- multiplier: 1
- source: close
- (v) Use EMA
- Bands Style: Average True Range
- ATR Length: 19
- Stop Loss (%): 20
- Take Profit (%) : 20
_________________________________
- length: 9
- multiplier: 1
- source: close
- (v) Use EMA
- Bands Style: Average True Range
- ATR Length: 18
- Stop Loss (%): 20
- Take Profit (%) : 5
_________________________________
▶ Usefulness and Originality
- Stop Loss and Take Profit functions are available
- Convenient Buy and Sell entry compared to the original Keltner Channel Strategy
- Optimized for BTCUSD market (maximizing profits)
___________________________________________
이 전략은 TradingView의 Built-in 전략인 Keltner Channel Strategy를 비트코인에 맞게 최적화되었습니다. 기존의 Keltner Channel Strategy는 Buy, Sell 신호가 캔들 중간에 실시간으로 떠서 진입 시점을 예측하기 어려운 불편함이 있었지만 이 전략은 비트코인 가격이 Keltner Channel 상단 혹은 하단을 찍고 종가를 마감하면 그 다음 캔들 시작가에서 Buy 혹은 Sell 진입이 가능하여 편리합니다. 또한, 이 전략은 Keltner Channel을 만나서 캔들을 마감한 가격 (bprice, sprice)을 시각적으로 plot을 제공하여 타점 및 차트를 보기에 편리하며 손절가 및 목표가를 지정한 백테스팅이 가능합니다.

Chaikin Money Flow + MACD + ATRHere I present you on of Trade Pro's Trading Idea: Chaikin Money Flow + MACD + ATR.
This strategy is not as profitable as it can be seen in one of his videos. In the forex market, the strategy could reach a maximum of 35% profitability.
I have, as some of my followers have requested, created an overview of the current position, risk and leverage settings in the form of a table.
Furthermore, one can again swap between short and long positions.
It is now possible to select or deselect individual indicators.
I have chosen the ATR alone as a take profit stop loss, as in his strategy.
A position is only triggered as soon as all prerequisites have been fulfilled and a command is executed. This prevents false triggering by bots and repainting.
-----------------------------------------------------------------------------------
How does the strategy work?
ENTRY
Long
The MACD indicator must be above the zero line.
Then the K line must cross the D line.
Finally, when this happens, the Money Flow Index must be above the zero line.
Short
Contrary to the premise of long positions.
EXIT
ATR Exit
The value of ATR at the time of buying is multiplied by the value entered in "Profit factor ATR" and "Stop factor ATR". As soon as the price reaches this value, it is closed.
Important
The script must be optimized for each coin or currency pair.
I will publish a guide to the strategy shortly. There I will explain how the table works and how to set the strategy correctly.
The results of the strategy are without commissions and leverage.
If you have any questions or feedback, please let me know in the comments.

TradePro's Trading Idea Cipher Divergence EMA Pb StrategyHere I present you on of Trade Pro's Trading Idea: Cipher B+ Divergence EMA Pullback Strategy.
Optimized the crypto pairBTC/USDT in the 30 minute chart.
There is the possibility to switch between short and long positions.
You can choose between 2 different take profit/stop loss types: The Lowest Low/ Highest High Stop Loss/ Take Profit and the ATR Take Profit/ Stop Loss.
-----------------------------------------------------------------------------------
How does the strategy work?
ENTRY
Long
The price must be above the 200 EMA .
The price needs to make a pullback into the 50 EMA .
Right after that, the Cipher B indicator must give a buy signal, it must be below the zero line and the Money Flow cloud must be green.
Short
Contrary to the premise of long positions.
EXIT
Lowest Low/ Highest High Exit
The Lowest Low (long) / highest high (short) serves as the stop loss. The TP is formed on the basis of a factor.
(Long for example: *Lowest Low* multiplied by *Profitfactor* = TP).
ATR Exit
The value of ATR at the time of buying is multiplied by the value entered in "Profit factor ATR" and "Stop factor ATR". As soon as the price reaches this value, it is closed.
Important
The script must be optimized for each coin or currency pair. However, only the values for the profit factor, the stop loss and Lowest Low / Highest High are relevant.
Also, by changing the Chanel Length and the Chanel Average, you can create strong profit changes.
The results of the strategy are without commissions and leverage.
If you have any questions or feedback, please let me know in the comments.
If you need more information about the strategy and want to know exactly how to apply it, check out my profile. There I have created a tutorial for the function of the script.

RSI+PA+DCA StrategyDear Tradingview community,
This RSI based trading strategy is created as a training exercise. I am not a professional trader, but a committed hobbyist. This not a finished trading strategy meant for trading, but more a combination of different trading ideas I liked to explore deeper. The aim with this exercise was to gain more knowledge and understanding about price averaging and dollar cost averaging strategies. Aside that I wanted to learn how to program a pyramiding strategy, how to plot different order entry layers and how to open positions on a specific time interval.
In this script I adapted code from a couple of strategy examples by Coinrule . Who wrote simple and powerful examples of RSI based strategies and pyramiding strategies.
Also the HOWTO scripts shared by vitvlkv were very helpful for this exercise. In the script description you can find all the sources to the code.
A PA strategy could be a helpful addition to ease the 'stress-management to buy when price drops and resolution in selling when the price is rising' (Coinrule).
The idea behind the strategy is fairly simple and is based on an RSI strategy of buying low. A position is entered when the RSI and moving average conditions are met. The position is closed when it reaches a specified take profit percentage. As soon as the first the position is openend multiple PA (price average) layers are setup based on a specified percentage of price drop. When the price crosses the layer another position with somewhat the same amount of assets is entered. This causes the average cost price (the red plot line) to decrease. If the price drops more, another similar amount of assets is bought with another price average decrease as result. When the price starts rising again the different positions are separately closed when each reaches its specified take profit. The positions can be re-openend when the price drops again. And so on. When the price rises more and crosses over the average price and reached the specified take profit on top of it, it closes all the positions at once and cancels all orders. From that moment on it waits for another price dip before it opens a new position.
Another option is to activate a DCA function that opens a position based on a fixed specified amount. It enters a position at the start of every week and only when there are already other positions openend and if the current price is below the average price of the position. Like this buying on a time interval can help lowering the average price in case the market is down.
I read in some articles that price averaging is also called dollar cost averaging as the result is somewhat the same. Although DCA is really based on buying on fixed time intervals. These strategies are both considered long term investment strategies that can be profitable in the long run and are not suitable for short term investment schemes. The downturn is that the postion size increases when the general market trend is going down and that you have to patiently wait until the market start rising again.
Another notable aspect is that the logic in this strategy works the way it does because the entries are exited based on the FIFO (first in first out) close entry rule. This means that the first exit is applied to the first entry position that is openend. In other words that when the third entry reaches its take profit level and exits, it actually exits the first entry. If you take a close look in the 'List of Trades' of your Strategy Tester panel, you can see that some 'Long1' entries are closed by an 'Exit 3' and not by an 'Exit 1'. This means that your trade partly loses, but causes a decrease in average price that is later balanced out by lower or repeated entering and closing other positions. You can change this logic to a real sequential way of closing your entries, but this changes the averaging logic considerably. In case you want to test this you need to change, in this line in the strategy call 'close_entries_rule = "FIFO"', the word FIFO to ANY.
In the settings you can specify the percentage of portfolio to use for each trade to spread the risk and for each order a trading fee of 0.075% is calculated.

Zignaly TutorialThis strategy serves as a beginner's guide to connect TradingView signals to Zignaly Crypto Trading Platform.
It was originally tested at BTCUSDT pair and 1D timeframe.
Before using this documentation it's recommended that you:
Use default TradingView strategy script or another script and setup its associated alert manually. Just make the alert pop-up in the screen.
Create a 'Copy-Trader provider' (or Signal Provider) in Zignaly and send signals to it either thanks to your browser or with some basic programming.
SETTINGS
__ SETTINGS - Capital
(CAPITAL) Capital quote invested per order in USDT units {100.0}. This setting is only used when '(ZIG) Provider type' is set to 'Signal Provider'.
(CAPITAL) Capital percentage invested per order (%) {25.0}. This setting is only used when '(ZIG) Provider type' is set to 'Copy Trader Provider'.
__ SETTINGS - Misc
(ZIG) Enable Alert message {True}: Whether to enable alert message or not.
(DEBUG) Enable debug on order comments {True}: Whether to show alerts on order comments or not.
Number of decimal digits for Prices {2}.
(DECIMAL) Maximum number of decimal for contracts {3}.
__ SETTINGS - Zignaly
(ZIG) Integration type {TradingView only}: Hybrid : Both TradingView and Zignaly handle take profit, trailing stops and stop losses. Useful if you are scared about TradingView not firing an alert. It might arise problems if TradingView and Zignaly get out of sync. TradingView only : TradingView sends entry and exit orders to Zignaly so that Zignaly only buys or sells. Zignaly won't handle stop loss or other settings on its own.
(ZIG) Zignaly Alert Type {WebHook}: 'Email' or 'WebHook'.
(ZIG) Provider type {Copy Trader Provider}: 'Copy Trader Provider' or 'Signal Provider'. 'Copy Trader Provider' sends a percentage to manage. 'Signal Provider' sends a quote to manage.
(ZIG) Exchange: 'Binance' or 'Kucoin'.
(ZIG) Exchange Type {Spot}: 'Spot' or 'Futures'.
(ZIG) Leverage {1}. Set it to '1' when '(ZIG) Exchange Type' is set to 'Spot'.
__ SETTINGS - Strategy
(STRAT) Strategy Type: 'Long and Short', 'Long Only' or 'Short Only'.
(STOPTAKE) Take Profit? {false}: Whether to enable Take Profit.
(STOPTAKE) Stop Loss? {True}: Whether to enable Stop Loss.
(TRAILING) Enable Trailing Take Profit (%) {True}: Whether to enable Trailing Take Profit.
(STOPTAKE) Take Profit % {3.0}: Take profit percentage. This setting is only used when '(STOPTAKE) Take Profit?' setting is set to true.
(STOPTAKE) Stop Loss % {2.0}: Stop loss percentage. This setting is only used when '(STOPTAKE) Stop Loss?' setting is set to true.
(TRAILING) Trailing Take Profit Trigger (%) {2.5}: Trailing Stop Trigger Percentage. This setting is only used when '(TRAILING) Enable Trailing Take Profit (%)' setting is set to true.
(TRAILING) Trailing Take Profit as a percentage of Trailing Take Profit Trigger (%) {25.0}: Trailing Stop Distance Percentage. This setting is only used when '(TRAILING) Enable Trailing Take Profit (%)' setting is set to true.
(RECENT) Number of minutes to wait to open a new order after the previous one has been opened {6}.
DEFAULT SETTINGS
By default this strategy has been setup with these beginner settings:
'(ZIG) Integration type' : TradingView only
'(ZIG) Provider type' : 'Copy Trader Provider'
'(ZIG) Exchange' : 'Binance'
'(ZIG) Exchange Type' : 'Spot'
'(STRAT) Strategy Type' : 'Long Only'
'(ZIG) Leverage' : '1' (Or no leverage)
but you can change those settings if needed.
FIRST STEP
For both future of spot markets you should make sure to change '(ZIG) Zignaly Alert Type' to match either WebHook or Email. If you have a non paid account in TradingView as in October 2020 you would have to use Email which it's free to use.
RECOMMENDED SETTINGS
__ RECOMMENDED SETTINGS - Spot markets
'(ZIG) Exchange Type' setting should be set to 'Spot'
'(STRAT) Strategy Type' setting should be set to 'Long Only'
'(ZIG) Leverage' setting should be set to '1'
__ RECOMMENDED SETTINGS - Future markets
'(ZIG) Exchange Type' setting should be set to 'Futures'
'(STRAT) Strategy Type' setting should be set to 'Long and Short'
'(ZIG) Leverage' setting might be changed if desired.
__ RECOMMENDED SETTINGS - Signal Providers
'(ZIG) Provider type' setting should be set to 'Signal Provider'
'(CAPITAL) Capital quote invested per order in USDT units' setting might be changed if desired.
__ RECOMMENDED SETTINGS - Copy Trader Providers
'(ZIG) Provider type' setting should be set to 'Copy Trader Provider'
'(CAPITAL) Capital percentage invested per order (%)' setting might be changed if desired.
Strategy Properties setting: 'Initial Capital' might be changed if desired.
INTEGRATION TYPE EXPLANATION
'Hybrid': Both TradingView and Zignaly handle take profit, trailing stops and stop losses. Useful if you are scared about TradingView not firing an alert. It might arise problems if TradingView and Zignaly get out of sync.
'TradingView only': TradingView sends entry and exit orders to Zignaly so that Zignaly only buys or sells. Zignaly won't handle stop loss or other settings on its own.
HOW TO USE THIS STRATEGY
Beginner: Copy and paste the strategy and change it to your needs. Turn off '(DEBUG) Enable debug on order comments' setting.
Medium: Reuse functions and inputs from this strategy into your own as if it was a library.
Advanced: Check Strategy Tester. List of trades. Copy and paste the different suggested 'alert_message' variable contents to your script.
Expert: I needed a way to pass data from TradingView script to the alert. Now I know it's the 'alert_message' variable. I can do this own my own.
ALERTS SETUP
This is the important piece of information that allows you to connect TradingView to Zignaly in a semi-automatic manner.
__ ALERTS SETUP - WebHook
Webhook URL: https : // zignaly . com / api / signals.php?key=MYSECRETKEY
Message: { {{strategy.order.alert_message}} , "key" : "MYSECRETKEY" }
__ ALERTS SETUP - Email
Setup a new Hotmail account
Add it as an 'SMS email' in TradingView Profile settings page.
Confirm your own the email address
Create a rule in your Hotmail account that 'Redirects' (not forwards) emails to 'signals @ zignaly . email' when (1): 'Subject' includes 'Alert', (2): 'Email body' contains string 'MYZIGNALYREDIRECTTRIGGER' and (3): 'From' contains 'noreply @ tradingview . com'.
In 'More Actions' check: Send Email-to-SMS
Message: ||{{strategy.order.alert_message}}||key=MYSECRETKEY||
MYZIGNALYREDIRECTTRIGGER
'(DEBUG) Enable debug on order comments' is turned on by default so that you can see in the Strategy Tester. List of Trades. The different orders alert_message that would have been sent to your alert. You might want to turn it off it some many letters in the screen is problem.
STRATEGY ADVICE
If you turn on 'Take Profit' then turn off 'Trailing Take Profit'.
ZIGNALY SIDE ADVICE
If you are a 'Signal Provider' make sure that 'Allow reusing the same signalId if there isn't any open position using it?' setting in the profile tab is set to true.
You can find your 'MYSECRETKEY' in your 'Copy Trader/Signal' provider Edit tab at 'Signal URL'.
ADDITIONAL ZIGNALY DOCUMENTATION
docs . zignaly . com / signals / how-to -- How to send signals to Zignaly
3 Ways to send signals to Zignaly
SIGNALS
FINAL REMARKS
This strategy tries to match the Pine Script Coding Conventions as best as possible.

Ruckard TradingLatinoThis strategy tries to mimic TradingLatino strategy.
The current implementation is beta.
Si hablas castellano o espanyol por favor consulta MENSAJE EN CASTELLANO más abajo.
It's aimed at BTCUSDT pair and 4h timeframe.
STRATEGY DEFAULT SETTINGS EXPLANATION
max_bars_back=5000 : This is a random number of bars so that the strategy test lasts for one or two years
calc_on_order_fills=false : To wait for the 4h closing is too much. Try to check if it's worth entering a position after closing one. I finally decided not to recheck if it's worth entering after an order is closed. So it is false.
calc_on_every_tick=false
pyramiding=0 : We only want one entry allowed in the same direction. And we don't want the order to scale by error.
initial_capital=1000 : These are 1000 USDT. By using 1% maximum loss per trade and 7% as a default stop loss by using 1000 USDT at 12000 USDT per BTC price you would entry with around 142 USDT which are converted into: 0.010 BTC . The maximum number of decimal for contracts on this BTCUSDT market is 3 decimals. E.g. the minimum might be: 0.001 BTC . So, this minimal 1000 amount ensures us not to entry with less than 0.001 entries which might have happened when using 100 USDT as an initial capital.
slippage=1 : Binance BTCUSDT mintick is: 0.01. Binance slippage: 0.1 % (Let's assume). TV has an integer slippage. It does not have a percentage based slippage. If we assume a 1000 initial capital, the recommended equity is 142 which at 11996 USDT per BTC price means: 0.011 BTC. The 0.1% slippage of: 0.011 BTC would be: 0.000011 . This is way smaller than the mintick. So our slippage is going to be 1. E.g. 1 (slippage) * 0.01 (mintick)
commission_type=strategy.commission.percent and commission_value=0.1 : According to: binance . com / en / fee / schedule in VIP 0 level both maker and taker fees are: 0.1 %.
BACKGROUND
Jaime Merino is a well known Youtuber focused on crypto trading
His channel TradingLatino
features monday to friday videos where he explains his strategy.
JAIME MERINO STANCE ON BOTS
Jaime Merino stance on bots (taken from memory out of a 2020 June video from him):
'~
You know. They can program you a bot and it might work.
But, there are some special situations that the bot would not be able to handle.
And, I, as a human, I would handle it. And the bot wouldn't do it.
~'
My long term target with this strategy script is add as many
special situations as I can to the script
so that it can match Jaime Merino behaviour even in non normal circumstances.
My alternate target is learn Pine script
and enjoy programming with it.
WARNING
This script might be bigger than other TradingView scripts.
However, please, do not be confused because the current status is beta.
This script has not been tested with real money.
This is NOT an official strategy from Jaime Merino.
This is NOT an official strategy from TradingLatino . net .
HOW IT WORKS
It basically uses ADX slope and LazyBear's Squeeze Momentum Indicator
to make its buy and sell decisions.
Fast paced EMA being bigger than slow paced EMA
(on higher timeframe) advices going long.
Fast paced EMA being smaller than slow paced EMA
(on higher timeframe) advices going short.
It finally add many substrats that TradingLatino uses.
SETTINGS
__ SETTINGS - Basics
____ SETTINGS - Basics - ADX
(ADX) Smoothing {14}
(ADX) DI Length {14}
(ADX) key level {23}
____ SETTINGS - Basics - LazyBear Squeeze Momentum
(SQZMOM) BB Length {20}
(SQZMOM) BB MultFactor {2.0}
(SQZMOM) KC Length {20}
(SQZMOM) KC MultFactor {1.5}
(SQZMOM) Use TrueRange (KC) {True}
____ SETTINGS - Basics - EMAs
(EMAS) EMA10 - Length {10}
(EMAS) EMA10 - Source {close}
(EMAS) EMA55 - Length {55}
(EMAS) EMA55 - Source {close}
____ SETTINGS - Volume Profile
Lowest and highest VPoC from last three days
is used to know if an entry has a support
VPVR of last 100 4h bars
is also taken into account
(VP) Use number of bars (not VP timeframe): Uses 'Number of bars {100}' setting instead of 'Volume Profile timeframe' setting for calculating session VPoC
(VP) Show tick difference from current price {False}: BETA . Might be useful for actions some day.
(VP) Number of bars {100}: If 'Use number of bars (not VP timeframe)' is turned on this setting is used to calculate session VPoC.
(VP) Volume Profile timeframe {1 day}: If 'Use number of bars (not VP timeframe)' is turned off this setting is used to calculate session VPoC.
(VP) Row width multiplier {0.6}: Adjust how the extra Volume Profile bars are shown in the chart.
(VP) Resistances prices number of decimal digits : Round Volume Profile bars label numbers so that they don't have so many decimals.
(VP) Number of bars for bottom VPOC {18}: 18 bars equals 3 days in suggested timeframe of 4 hours. It's used to calculate lowest session VPoC from previous three days. It's also used as a top VPOC for sells.
(VP) Ignore VPOC bottom advice on long {False}: If turned on it ignores bottom VPOC (or top VPOC on sells) when evaluating if a buy entry is worth it.
(VP) Number of bars for VPVR VPOC {100}: Number of bars to calculate the VPVR VPoC. We use 100 as Jaime once used. When the price bounces back to the EMA55 it might just bounce to this VPVR VPoC if its price it's lower than the EMA55 (Sells have inverse algorithm).
____ SETTINGS - ADX Slope
ADX Slope
help us to understand if ADX
has a positive slope, negative slope
or it is rather still.
(ADXSLOPE) ADX cut {23}: If ADX value is greater than this cut (23) then ADX has strength
(ADXSLOPE) ADX minimum steepness entry {45}: ADX slope needs to be 45 degrees to be considered as a positive one.
(ADXSLOPE) ADX minimum steepness exit {45}: ADX slope needs to be -45 degrees to be considered as a negative one.
(ADXSLOPE) ADX steepness periods {3}: In order to avoid false detection the slope is calculated along 3 periods.
____ SETTINGS - Next to EMA55
(NEXTEMA55) EMA10 to EMA55 bounce back percentage {80}: EMA10 might bounce back to EMA55 or maybe to 80% of its complete way to EMA55
(NEXTEMA55) Next to EMA55 percentage {15}: How much next to the EMA55 you need to be to consider it's going to bounce back upwards again.
____ SETTINGS - Stop Loss and Take Profit
You can set a default stop loss or a default take profit.
(STOPTAKE) Stop Loss % {7.0}
(STOPTAKE) Take Profit % {2.0}
____ SETTINGS - Trailing Take Profit
You can customize the default trailing take profit values
(TRAILING) Trailing Take Profit (%) {1.0}: Trailing take profit offset in percentage
(TRAILING) Trailing Take Profit Trigger (%) {2.0}: When 2.0% of benefit is reached then activate the trailing take profit.
____ SETTINGS - MAIN TURN ON/OFF OPTIONS
(EMAS) Ignore advice based on emas {false}.
(EMAS) Ignore advice based on emas (On closing long signal) {False}: Ignore advice based on emas but only when deciding to close a buy entry.
(SQZMOM) Ignore advice based on SQZMOM {false}: Ignores advice based on SQZMOM indicator.
(ADXSLOPE) Ignore advice based on ADX positive slope {false}
(ADXSLOPE) Ignore advice based on ADX cut (23) {true}
(STOPTAKE) Take Profit? {false}: Enables simple Take Profit.
(STOPTAKE) Stop Loss? {True}: Enables simple Stop Loss.
(TRAILING) Enable Trailing Take Profit (%) {True}: Enables Trailing Take Profit.
____ SETTINGS - Strategy mode
(STRAT) Type Strategy: 'Long and Short', 'Long Only' or 'Short Only'. Default: 'Long and Short'.
____ SETTINGS - Risk Management
(RISKM) Risk Management Type: 'Safe', 'Somewhat safe compound' or 'Unsafe compound'. ' Safe ': Calculations are always done with the initial capital (1000) in mind. The maximum losses per trade/day/week/month are taken into account. ' Somewhat safe compound ': Calculations are done with initial capital (1000) or a higher capital if it increases. The maximum losses per trade/day/week/month are taken into account. ' Unsafe compound ': In each order all the current capital is gambled and only the default stop loss per order is taken into account. That means that the maximum losses per trade/day/week/month are not taken into account. Default : 'Somewhat safe compound'.
(RISKM) Maximum loss per trade % {1.0}.
(RISKM) Maximum loss per day % {6.0}.
(RISKM) Maximum loss per week % {8.0}.
(RISKM) Maximum loss per month % {10.0}.
____ SETTINGS - Decimals
(DECIMAL) Maximum number of decimal for contracts {3}: How small (3 decimals means 0.001) an entry position might be in your exchange.
EXTRA 1 - PRICE IS IN RANGE indicator
(PRANGE) Print price is in range {False}: Enable a bottom label that indicates if the price is in range or not.
(PRANGE) Price range periods {5}: How many previous periods are used to calculate the medians
(PRANGE) Price range maximum desviation (%) {0.6} ( > 0 ): Maximum positive desviation for range detection
(PRANGE) Price range minimum desviation (%) {0.6} ( > 0 ): Mininum negative desviation for range detection
EXTRA 2 - SQUEEZE MOMENTUM Desviation indicator
(SQZDIVER) Show degrees {False}: Show degrees of each Squeeze Momentum Divergence lines to the x-axis.
(SQZDIVER) Show desviation labels {False}: Whether to show or not desviation labels for the Squeeze Momentum Divergences.
(SQZDIVER) Show desviation lines {False}: Whether to show or not desviation lines for the Squeeze Momentum Divergences.
EXTRA 3 - VOLUME PROFILE indicator
WARNING: This indicator works not on current bar but on previous bar. So in the worst case it might be VP from 4 hours ago. Don't worry, inside the strategy calculus the correct values are used. It's just that I cannot show the most recent one in the chart.
(VP) Print recent profile {False}: Show Volume Profile indicator
(VP) Avoid label price overlaps {False}: Avoid label prices to overlap on the chart.
EXTRA 4 - ZIGNALY SUPPORT
(ZIG) Zignaly Alert Type {Email}: 'Email', 'Webhook'. ' Email ': Prepare alert_message variable content to be compatible with zignaly expected email content format. ' Webhook ': Prepare alert_message variable content to be compatible with zignaly expected json content format.
EXTRA 5 - DEBUG
(DEBUG) Enable debug on order comments {False}: If set to true it prepares the order message to match the alert_message variable. It makes easier to debug what would have been sent by email or webhook on each of the times an order is triggered.
HOW TO USE THIS STRATEGY
BOT MODE: This is the default setting.
PROPER VOLUME PROFILE VIEWING: Click on this strategy settings. Properties tab. Make sure Recalculate 'each time the order was run' is turned off.
NEWBIE USER: (Check PROPER VOLUME PROFILE VIEWING above!) You might want to turn on the 'Print recent profile {False}' setting. Alternatively you can use my alternate realtime study: 'Resistances and supports based on simplified Volume Profile' but, be aware, it might consume one indicator.
ADVANCED USER 1: Turn on the 'Print price is in range {False}' setting and help us to debug this subindicator. Also help us to figure out how to include this value in the strategy.
ADVANCED USER 2: Turn on the all the (SQZDIVER) settings and help us to figure out how to include this value in the strategy.
ADVANCED USER 3: (Check PROPER VOLUME PROFILE VIEWING above!) Turn on the 'Print recent profile {False}' setting and report any problem with it.
JAIME MERINO: Just use the indicator as it comes by default. It should only show BUY signals, SELL signals and their associated closing signals. From time to time you might want to check 'ADVANCED USER 2' instructions to check that there's actually a divergence. Check also 'ADVANCED USER 1' instructions for your amusement.
EXTRA ADVICE
It's advised that you use this strategy in addition to these two other indicators:
* Squeeze Momentum Indicator
* ADX
so that your chart matches as close as possible to TradingLatino chart.
ZIGNALY INTEGRATION
This strategy supports Zignaly email integration by default. It also supports Zignaly Webhook integration.
ZIGNALY INTEGRATION - Email integration example
What you would write in your alert message:
||{{strategy.order.alert_message}}||key=MYSECRETKEY||
ZIGNALY INTEGRATION - Webhook integration example
What you would write in your alert message:
{ {{strategy.order.alert_message}} , "key" : "MYSECRETKEY" }
CREDITS
I have reused and adapted some code from
'Directional Movement Index + ADX & Keylevel Support' study
which it's from TradingView console user.
I have reused and adapted some code from
'3ema' study
which it's from TradingView hunganhnguyen1193 user.
I have reused and adapted some code from
'Squeeze Momentum Indicator ' study
which it's from TradingView LazyBear user.
I have reused and adapted some code from
'Strategy Tester EMA-SMA-RSI-MACD' study
which it's from TradingView fikira user.
I have reused and adapted some code from
'Support Resistance MTF' study
which it's from TradingView LonesomeTheBlue user.
I have reused and adapted some code from
'TF Segmented Linear Regression' study
which it's from TradingView alexgrover user.
I have reused and adapted some code from
"Poor man's volume profile" study
which it's from TradingView IldarAkhmetgaleev user.
FEEDBACK
Please check the strategy source code for more detailed information
where, among others, I explain all of the substrats
and if they are implemented or not.
Q1. Did I understand wrong any of the Jaime substrats (which I have implemented)?
Q2. The strategy yields quite profit when we should long (EMA10 from 1d timeframe is higher than EMA55 from 1d timeframe.
Why the strategy yields much less profit when we should short (EMA10 from 1d timeframe is lower than EMA55 from 1d timeframe)?
Any idea if you need to do something else rather than just reverse what Jaime does when longing?
FREQUENTLY ASKED QUESTIONS
FAQ1. Why are you giving this strategy for free?
TradingLatino and his fellow enthusiasts taught me this strategy. Now I'm giving back to them.
FAQ2. Seriously! Why are you giving this strategy for free?
I'm confident his strategy might be improved a lot. By keeping it to myself I would avoid other people contributions to improve it.
Now that everyone can contribute this is a win-win.
FAQ3. How can I connect this strategy to my Exchange account?
It seems that you can attach alerts to strategies.
You might want to combine it with a paying account which enable Webhook URLs to work.
I don't know how all of this works right now so I cannot give you advice on it.
You will have to do your own research on this subject. But, be careful. Automating trades, if not done properly,
might end on you automating losses.
FAQ4. I have just found that this strategy by default gives more than 3.97% of 'maximum series of losses'. That's unacceptable according to my risk management policy.
You might want to reduce default stop loss setting from 7% to something like 5% till you are ok with the 'maximum series of losses'.
FAQ5. Where can I learn more about your work on this strategy?
Check the source code. You might find unused strategies. Either because there's not a substantial increases on earnings. Or maybe because they have not been implemented yet.
FAQ6. How much leverage is applied in this strategy?
No leverage.
FAQ7. Any difference with original Jaime Merino strategy?
Most of the times Jaime defines an stop loss at the price entry. That's not the case here. The default stop loss is 7% (but, don't be confused it only means losing 1% of your investment thanks to risk management). There's also a trailing take profit that triggers at 2% profit with a 1% trailing.
FAQ8. Why this strategy return is so small?
The strategy should be improved a lot. And, well, backtesting in this platform is not guaranteed to return theoric results comparable to real-life returns. That's why I'm personally forward testing this strategy to verify it.
MENSAJE EN CASTELLANO
En primer lugar se agradece feedback para mejorar la estrategia.
Si eres un usuario avanzado y quieres colaborar en mejorar el script no dudes en comentar abajo.
Ten en cuenta que aunque toda esta descripción tenga que estar en inglés no es obligatorio que el comentario esté en inglés.
CHISTE - CASTELLANO
¡Pero Jaime!
¡400.000!
¡Tu da mun!

BV's MACD SIGNAL TESTERHello ladies and gentlemen,
Today, as you may have seen in the title, I have coded a strategy to determine once and for all if MACD could make you money in 2020.
So, at the end of this video, you will know which MACD strategy will bring you the most money.
Spoiler alert: we've hit the 90% WinRAte mark on the Euro New Zealand Dollar chart.
I've seen a lot of videos of people testing different MACD signals, some up to 100 times.
But In my opinion, all traders must rely on statistics to put all the odds on their side and good statistics require a lot more data.
The algorithm I'm showing you tests each signal one by one over a 3 year period and on 28 different graphs.
That way we are sure that we have encountered all possible market behavior.
From phases of congestion to major trends or even the effects of COVID-19
I use the ATR to determine my Stop Loss and Take Profits. The Stop Loss is placed at 1.5 times the ATR, the Take Profit is placed at 1 time the ATR.
If my Take Profit is hit, I take 50% of the profits and let the position run by moving my Stop Loss to Zero.
This way, the position can no longer be a losing position.
If you are not familiar with this practice, I invite you to study the "Scaling out" video from the NoNonsenseForex channel.
BV's Trading Journal.

QuantCat Mom Finder Strategy (1H)QuantCat Momentum Finder Strategy
This strategy is designed to be used on the 1 hour time frame, on all x/btc pairs.
The beautiful thing is it plots the take profit, and stoploss for you for each entry- where I would say use the stoploss for sure and feel with water with how the price action is looking when in profit.
In this strategy, I actually implemented my own trading style into building the strategy. Having to replicate my own trading strategy into an algorithm, I can't make it exactly perfect to how I would trade, but what I can do is try and program the parameters that give it the absolute best chance of making a big move with a small drawdown- which replicates part of my momentum trading style. Here I am using RSI, MACD, EMA and trend filtering values to find moments where there has been a momentum change to play the rest of the move. It only picks the best entries.
There is always a 3-4 R/R move on average with with these trades, meaning 1 in 4 only need to hit to be a break even trader- where most of these strategies have about 35% hit rate.
The stoploss is so crucial to minimise any damage from huge unexpected candles, the strategies can just be used for entries as well, you don't have to stick to the exact formula- of the long and short system, but this by itself is profitable.
The system nets positive results on
-ETH/BTC
-LTC/BTC
-XRP/BTC
-ADA/BTC
-NEO/BTC etc.
We also have a free 15M strategy available too.
You can join our discord server to get live alerts for the strategy as well as speak to our devs! Link in signature below!!!

Renko Strategy Open_CloseSimple Renko strategy, very profitable. Thanks to vacalo69 for the idea.
Rules when the strategy opens order at market as follows:
- Buy when previous brick (-1) was bearish and previous brick (-2) was bearish too and actual brick close is bullish
- Sell when previous brick (-1) was bullish and previous brick (-2) was bullish too and actual brick close is bearish
Rules when the strategy send stop order are the same but this time a stop buy or stop sell is placed (better overall results).
Note that strategy open an order only after that condition is met, at the beginning of next candle, so the actual close is not the actual price.
Only input is the brick size multiplier for stop loss and take profit: SL and TP are placed at (brick size)x(multiplier) Or put it very high if you want startegy to close order on opposite signal.
Adjust brick size considering:
- Strategy works well if there are three or more consecutive bricks of same "color"
- Expected Profit
- Drawdown
- Time on trade
This strategy uses Renko charts with TRADITIONAL bricks, so no repaint.
Study with alerts, MT4 expert advisor and jforex automatic strategy are available at request.
Please use comment section for any feedback.

(CRT) MTF Candle Range Theory Model# 🚀 **CASH Pro MTF – Candle Range Theory (CRT) Indicator**
**The Smart Money ICT Setup Detector** 🔥
Hey Traders!
Here is the **ultimate Pine Script indicator** that automatically detects one of the most powerful Smart Money / ICT setups: **Candle Range Theory (CRT)**
---
### What is Candle Range Theory – CRT?
**CRT** is a high-probability price action model based on **liquidity grabs** and **range expansion**.
Price loves to:
1️⃣ Raid the low/high of the previous candle (take stop-losses)
2️⃣ Then reverse and run to the opposite side of the range (or beyond)
When this happens near a **key higher-timeframe level**, magic happens!
### Bullish CRT Model
- Price touches a **strong HTF support**
- Previous candle closes near that support
- Next candle **sweeps the low** (grabs liquidity)
- Current candle **closes above the raided low AND breaks the high** of the sweep candle
**Result → Aggressive bullish move expected!**
**Entry:** On close above the high (or on retest + MSS)
**Stop Loss:** Below the swept low
**Take Profit:** CRT High or next liquidity pool
### Bearish CRT Model
- Price touches a **strong HTF resistance**
- Previous candle closes near resistance
- Next candle **sweeps the high** (grabs buy stops)
- Current candle **closes below the raided high AND breaks the low** of the sweep candle
**Result → Strong bearish expansion!**
**Entry:** On close below the low
**Stop Loss:** Above the swept high
**Take Profit:** CRT Low or next downside liquidity
This whole setup can form in **just 3 candles**… or sometimes more if price consolidates after the sweep.
---
### Why This Indicator is Special
This is **NOT** a simple 3-candle pattern scanner!
This is a **true CRT + MTF confluence beast** with:
- **Multi-Timeframe Confirmation** (default 4H – fully customizable)
- **Built-in RSI Filter** (avoid fake moves in overbought/oversold)
- **Day-2 High/Low Levels** automatically drawn (the exact CRT range!)
- **Clean “LONG” / “SHORT” labels** right on the candle (no ugly arrows or offset)
- **Background highlight** on signal
- **Fully grouped inputs** – super clean settings panel
---
### Features at a Glance
| Feature | Included |
|--------------------------------|----------|
| Higher Timeframe Confirmation | Yes |
| RSI Overbought/Oversold Filter | Yes |
| Day-2 High/Low Lines + Labels | Yes |
| Clean Text Signals (no offset) | Yes |
| Background Highlight | Yes |
| Fully Customizable Colors & Text| Yes |
| Works on All Markets & TFs | Yes |
---
### How to Use
1. Add the indicator to your chart
2. Wait for a **LONG** or **SHORT** label to appear
3. Confirm price is near a **key HTF level** (order block, FVG, etc.)
4. Enter on close or retest (your choice)
5. Manage risk with the drawn Day-2 levels
**Pro Tip:** Combine with ICT Market Structure Shift (MSS) or Fair Value Gaps for even higher accuracy!

Vital Wave 20-50Simplicity is almost always the most effective approach, and here I’m giving you a trend-following system that exploits the bullish bias of traditional markets and their trending nature, with very basic rules.
Rules (long entries only)
• Market entry: When the EMA 20 crosses above the EMA 50 (from below)
• Main market exit: When the EMA 20 crosses below the EMA 50 (from above)
• Fixed Stop Loss: Placed at the price level of the Lower Bollinger Band at the moment the trade is entered.
In my strategy, the primary exit is when the EMA 20 crosses below the EMA 50. However, this crossover can sometimes take a while to occur, and in the meantime the price may have already dropped significantly. The Stop Loss based on the Lower Bollinger Band is designed to limit losses in case the market moves sharply against the position without giving the bearish crossover signal in time. Having two exit conditions makes the strategy much more robust in terms of risk management.
Risk Management:
• Initial capital: $10,000
• Position size: 10% of available capital per trade
• Commissions: 0.1% on traded volume
• Stop Loss: Based on the Lower Bollinger Band
• Take Profit / Exit: When EMA 20 crosses below EMA 50
Recommended Markets:
XAUUSD (OANDA) (Daily)
Period: January 3, 1833 – November 23, 2025
Total Profit & Loss: +$6,030.62 USD (+57.57%)
Maximum Drawdown: $541.53 USD (3.83%)
Total Trades: 136
Winning Trades (Win Rate): 36.03% (49/136)
Profit Factor: 2.483
XAUUSD (OANDA) (12-hour)
Period: March 19, 2006 – November 23, 2025
Total Profit & Loss: +$1,209.56 USD (+11.89%)
Maximum Drawdown: $384.58 USD (3.61%)
Total Trades: 97
Winning Trades (Win Rate): 35.05% (34/97)
Profit Factor: 1.676
XAUUSD (OANDA) (8-hour)
Period: March 19, 2006 – November 23, 2025
Total Profit & Loss: +$1,179.36 USD (+11.81%)
Maximum Drawdown: $246.88 USD (2.32%)
Total Trades: 147
Winning Trades (Win Rate): 31.97% (47/147)
Profit Factor: 1.626
Tesla (NASDAQ) (4-hour)
Period: June 29, 2010 – November 23, 2025
Total Profit & Loss (Absolute): +$11,687.90 USD (+116.88%)
Maximum Drawdown: $922.05 USD (6.50%)
Total Trades: 68
Winning Trades (Win Rate): 39.71% (27/68)
Profit Factor: 4.156
Tesla (NASDAQ) (3-hour)
Total Profit & Loss: +$11,522.33 USD (+115.22%)
Maximum Drawdown: $1,247.60 USD (8.80%)
Total Trades: 114
Winning Trades: 33.33% (38/114)
Profit Factor: 2.811
Additional Recommendations
(These assets have shown good trending behavior with the same strategy across multiple timeframes):
• NVDA (15 min, 30 min, 1h, 2h, 3h, 4h, 6h, 8h, 12h, Daily)
• NFLX (1h, 2h, 3h, 4h, 6h, 8h, 12h, Daily)
• MA (1h, 2h, 3h, 4h, 6h, 8h, 12h, Daily)
• META (1h, 2h, 3h, 4h, 6h, 8h, 12h, Daily)
• AAPL (1h, 2h, 3h, 4h, 6h, 8h, 12h, Daily)
• SPY (12h, Daily)
About the Code
The user can modify:
• EMA periods (20 and 50 by default)
• Bollinger Bands length (20 periods)
• Standard deviation (2.0)
Visualization
• EMA 20: Blue line
• EMA 50: Red line
• Green background when EMA20 > EMA50 (bullish trend)
• Red background when EMA20 < EMA50 (bearish trend)
Important Note:
We can significantly increase the profit factor and overall profitability by risking a fixed percentage per trade instead of a fixed amount. This would prevent losses from fluctuating with changes in volatility.
This could be implemented by reducing position size or adjusting leverage based on the volatility percentage required for each trade, but I’m not sure if this is fully possible in Pine Script. In my other script, “ Golden Cross 50/200 EMA ,” I go deeper into this topic and provide examples.
I hope you enjoy this contribution. Best regards!

Hash Momentum IndicatorHash Momentum Indicator
Overview
The Hash Momentum Indicator provides real-time momentum-based trading signals with visual entry/exit markers and automatic risk management levels. This is the indicator version of the popular Hash Momentum Strategy, designed for traders who want signal alerts without backtesting functionality.
Perfect for: Live trading, automation via alerts, multi-indicator setups, and clean chart visualization.
What Makes This Indicator Special
1. Pure Momentum-Based Signals
Captures price acceleration in real-time - not lagging moving average crossovers. Enters when momentum exceeds a dynamic ATR-based threshold, catching moves as they begin accelerating.
2. Automatic Risk Management Visualization
Every signal automatically displays:
Entry level (white dashed line)
Stop loss level (red line)
Take profit target (green line)
Partial TP levels (dotted green lines)
3. Smart Trade Management
Trade Cooldown: Prevents overtrading by enforcing waiting period between signals
EMA Trend Filter: Only trades with the trend (optional)
Session Filters: Trade only during Tokyo/London/New York sessions (optional)
Weekend Toggle: Avoid low-liquidity weekend periods (optional)
4. Clean Visual Design
🟢 Tiny green dot = Long entry signal
🔴 Tiny red dot = Short entry signal
🔵 Blue X = Long exit
🟠 Orange X = Short exit
No cluttered labels or dashboard - just clean signals
5. Professional Alerts Ready
Set up TradingView alerts for:
Long signals
Short signals
Long exits
Short exits
How It Works
Step 1: Calculate Momentum
Momentum = Current Price - Price
Normalized by standard deviation for consistency
Must exceed ATR × Threshold to trigger
Step 2: Confirm Acceleration
Momentum must be increasing (positive momentum change)
Price must be moving in signal direction
Step 3: Apply Filters
EMA Filter: Long only above EMA, short only below EMA (if enabled)
Session Filter: Check if in allowed trading session (if enabled)
Weekend Filter: Block signals on Sat/Sun (if enabled)
Cooldown: Ensure minimum bars passed since last signal
Step 4: Generate Signal
All conditions met = Entry signal fires
Lines automatically drawn for entry, stop, and targets
Step 5: Exit Detection
Opposite momentum detected = Exit signal
Stop loss or take profit hit = Exit signal
Lines removed from chart
⚙️ Settings Guide
Core Strategy
Momentum Length (Default: 13)
Number of bars for momentum calculation. Higher values = stronger signals but fewer trades.
Aggressive: 10
Balanced: 13
Conservative: 18-24
Momentum Threshold (Default: 2.25)
ATR multiplier for signal generation. Higher values = only trade the biggest momentum moves.
Aggressive: 2.0
Balanced: 2.25
Conservative: 2.5-3.0
Risk:Reward Ratio (Default: 2.5)
Your target profit as a multiple of your risk. With 2.2% stop and 2.5 R:R, your target is 5.5% profit.
Conservative: 3.0+ (need 25% win rate to profit)
Balanced: 2.5 (need 29% win rate to profit)
Aggressive: 2.0 (need 33% win rate to profit)

Hash Momentum Strategy# Hash Momentum Strategy
## 📊 Overview
The **Hash Momentum Strategy** is a professional-grade momentum trading system designed to capture strong directional price movements with precision timing and intelligent risk management. Unlike traditional EMA crossover strategies, this system uses momentum acceleration as its primary signal, resulting in earlier entries and better risk-to-reward ratios.
---
## ⚡ What Makes This Strategy Unique
### 1. Momentum-Based Entry System
Most strategies rely on lagging indicators like moving average crossovers. This strategy captures momentum *acceleration* - entering when price movement is gaining strength, not after the move has already happened.
### 2. Programmable Risk-to-Reward
Set your exact R:R ratio (1:2, 1:2.5, 1:3, etc.) and the strategy automatically calculates stop loss and take profit levels. No more guessing or manual calculations.
### 3. Smart Partial Profit Taking
Lock in profits at multiple stages:
- **First TP**: Take 50% off at 2R
- **Second TP**: Take 40% off at 2.5R
- **Final TP**: Let 10% ride to maximum target
This approach locks in gains while letting winners run.
### 4. Dynamic Momentum Threshold
Uses ATR (Average True Range) multiplied by your threshold setting to adapt to market volatility. Volatile markets = higher threshold. Quiet markets = lower threshold.
### 5. Trade Cooldown System
Prevents overtrading and revenge trading by enforcing a cooldown period between trades. Configurable from 1-24 bars.
### 6. Optional Session & Weekend Filters
Filter trades by Tokyo, London, and New York sessions. Optional weekend-off toggle to avoid low-liquidity periods.
---
## 🎯 How It Works
### Signal Generation
**STEP 1: Calculate Momentum**
- Momentum = Current Price - Price
- Check if Momentum > ATR × Threshold Multiplier
- Momentum must be accelerating (positive change in momentum)
**STEP 2: Confirm with EMA Trend Filter**
- Long: Price must be above EMA
- Short: Price must be below EMA
**STEP 3: Check Filters**
- Not in cooldown period
- Valid session (if enabled)
- Not weekend (if enabled)
**STEP 4: ENTRY SIGNAL TRIGGERED**
### Risk Management Example
**Example Long Trade:**
- Entry: $100
- Stop Loss: $97.80 (2.2% risk)
- Risk Amount: $2.20
**Take Profit Levels:**
- TP1: $104.40 (2R = $4.40) → Close 50%
- TP2: $105.50 (2.5R = $5.50) → Close 40%
- Final: $105.50 (2.5R) → Close remaining 10%
---
## ⚙️ Settings Guide
### Core Strategy
**Momentum Length** (Default: 13)
Number of bars for momentum calculation. Higher = stronger but fewer signals.
**Momentum Threshold** (Default: 2.25)
ATR multiplier. Higher = only trade biggest moves.
**Use EMA Trend Filter** (Default: ON)
Only long above EMA, short below EMA.
**EMA Length** (Default: 28)
Period for trend-confirming EMA.
### Filters
**Use Trading Session Filter** (Default: OFF)
Restrict trading to specific sessions.
**Tokyo Session** (Default: OFF)
Trade during Asian hours (00:00-09:00 JST).
**London Session** (Default: OFF)
Trade during European hours (08:00-17:00 GMT).
**New York Session** (Default: OFF)
Trade during US hours (08:00-17:00 EST).
**Weekend Off** (Default: OFF)
Disable trading on Saturdays and Sundays.
### Risk Management
**Stop Loss %** (Default: 2.2)
Fixed percentage stop loss from entry.
**Risk:Reward Ratio** (Default: 2.5)
Your target reward as multiple of risk.
**Use Partial Profit Taking** (Default: ON)
Take profits in stages.
**First TP R:R** (Default: 2.0)
First target as multiple of risk.
**First TP Size %** (Default: 50)
Percentage of position to close at TP1.
**Second TP R:R** (Default: 2.5)
Second target as multiple of risk.
**Second TP Size %** (Default: 40)
Percentage of position to close at TP2.
### Trade Management
**Use Trade Cooldown** (Default: ON)
Prevent overtrading.
**Cooldown Bars** (Default: 6)
Bars to wait after closing a trade.
---
## 🎨 Visual Elements
### Chart Indicators
🟢 **Green Dot** (below bar) = Long entry signal
🔴 **Red Dot** (above bar) = Short entry signal
🔵 **Blue X** (above bar) = Long position closed
🟠 **Orange X** (below bar) = Short position closed
**EMA Line** = Trend direction (green when bullish, red when bearish)
**White Line** = Entry price
**Red Line** = Stop loss level
**Green Lines** = Take profit levels (TP1, TP2, Final)
### Dashboard
When not in real-time mode, a dashboard displays:
- Current position (LONG/SHORT/FLAT)
- Entry price
- Stop loss price
- Take profit price
- R:R ratio
- Current momentum strength
- Total trades
- Win rate
- Net profit %
---
## 📈 Recommended Settings by Timeframe
### 1-Hour Timeframe (Default)
- Momentum Length: 13
- Momentum Threshold: 2.25
- EMA Length: 28
- Stop Loss: 2.2%
- R:R Ratio: 2.5
- Cooldown: 6 bars
### 4-Hour Timeframe
- Momentum Length: 24-36
- Momentum Threshold: 2.5
- EMA Length: 50
- Stop Loss: 3-4%
- R:R Ratio: 2.0-2.5
- Cooldown: 6-8 bars
### 15-Minute Timeframe
- Momentum Length: 8-10
- Momentum Threshold: 2.0
- EMA Length: 20
- Stop Loss: 1.5-2%
- R:R Ratio: 2.0
- Cooldown: 4-6 bars
---
## 🔧 Optimization Tips
### Want More Trades?
- Decrease Momentum Threshold (2.0 instead of 2.25)
- Decrease Momentum Length (10 instead of 13)
- Decrease Cooldown Bars (4 instead of 6)
### Want Higher Quality Trades?
- Increase Momentum Threshold (2.5-3.0)
- Increase Momentum Length (18-24)
- Increase Cooldown Bars (8-10)
### Want Lower Drawdown?
- Increase Cooldown Bars
- Use tighter stop loss
- Enable session filters (trade only high-liquidity sessions)
- Enable Weekend Off
### Want Higher Win Rate?
- Increase R:R Ratio (may reduce total profit)
- Increase Momentum Threshold (fewer but stronger signals)
- Use longer EMA for trend confirmation
---
## 📊 Performance Expectations
Based on typical backtesting results:
- **Win Rate**: 35-45%
- **Profit Factor**: 1.5-2.0
- **Risk:Reward**: 1:2.5 (configurable)
- **Max Drawdown**: 10-20%
- **Trades/Month**: 8-15 (1H timeframe)
**Note:** Win rate may appear low, but with 2.5:1 R:R, you only need ~29% win rate to break even. The strategy aims for quality over quantity.
---
## 🎓 Strategy Logic Explained
### Why Momentum > EMA Crossover?
**EMA Crossover Problems:**
- Signals lag behind price
- Late entries = poor R:R
- Many false signals in ranging markets
**Momentum Advantages:**
- Catches moves as they start accelerating
- Earlier entries = better R:R
- Adapts to volatility via ATR
### Why Partial Profit Taking?
**Without Partial TPs:**
- All-or-nothing approach
- Winners often turn to losers
- High stress watching open positions
**With Partial TPs:**
- Lock in 50% at first target
- Reduce risk to breakeven
- Let remainder ride for bigger gains
- Lower psychological pressure
### Why Trade Cooldown?
**Without Cooldown:**
- Revenge trading after losses
- Overtrading in choppy markets
- Emotional decision-making
**With Cooldown:**
- Forces discipline
- Waits for new setup to develop
- Reduces transaction costs
- Better signal quality
---
## ⚠️ Important Notes
1. **This is a momentum strategy, not an EMA strategy**
The EMA only confirms trend direction. Momentum generates the actual signals.
2. **Backtest thoroughly before live trading**
Past performance ≠ future results. Test on your specific asset and timeframe.
3. **Use proper position sizing**
Risk 1-2% of account per trade maximum. The strategy uses 100% equity by default (adjust in Properties).
4. **Dashboard auto-hides in real-time**
Clean chart for live trading. Visible during backtesting.
5. **Customize for your trading style**
All settings are fully adjustable. No single "best" configuration.
---
## 🚀 Quick Start Guide
1. **Add to Chart**: Apply to your preferred asset and timeframe
2. **Keep Defaults**: Start with default settings
3. **Backtest**: Review historical performance
4. **Paper Trade**: Test with simulated money first
5. **Go Live**: Start small and scale up
---
## 💡 Pro Tips
**Tip 1: Combine Timeframes**
Use higher timeframe (4H) for trend direction, lower timeframe (1H) for entries.
**Tip 2: Avoid News Events**
Major news can cause whipsaws. Consider manual intervention during high-impact events.
**Tip 3: Monitor Momentum Strength**
Dashboard shows momentum in sigma (σ). Values >1.0σ indicate very strong momentum.
**Tip 4: Adjust for Volatility**
In high-volatility markets, increase threshold and stop loss. In quiet markets, decrease them.
**Tip 5: Review Losing Trades**
Check if losses are hitting stop loss or reversing. Adjust stop accordingly.
---
## 📝 Changelog
**v1.0** - Initial Release
- Momentum-based signal generation
- EMA trend filter
- Programmable R:R ratio
- Partial profit taking (3 stages)
- Trade cooldown system
- Session filters (Tokyo/London/New York)
- Weekend off toggle
- Smart dashboard (auto-hides in real-time)
- Clean visual design
---
## 🙏 Credits
Developed by **Hash Capital Research**
If you find this strategy useful, please give it a like and share with others!
---
## ⚖️ Disclaimer
This strategy is for educational purposes only. Trading involves substantial risk of loss and is not suitable for all investors. Past performance is not indicative of future results. Always do your own research and consult with a qualified financial advisor before trading.
---
## 📬 Feedback
Have suggestions or found a bug? Leave a comment below! I'm continuously improving this strategy based on community feedback.
---
**Happy Trading! 🚀📈**
